Getting Started: Daily & Monthly Flux Footprints
This notebook shows how to use ``ffp_daily_monthly_helper.py`` to:
load AmeriFlux half‑hourly data,
compute an xarray-based footprint climatology,
summarize to daily/monthly periods (optionally ET‑weighted), and
export 80% source‑area contours to a GeoPackage or rasters to GeoTIFF.
References: ffp_daily_monthly_helper.py【8†source】 and ffp_xr.py【9†source】.
Requirements
This workflow uses: numpy, pandas, xarray, matplotlib, and for exports geopandas, pyproj, shapely, rasterio.
[1]:
# --- Imports ---
import os
from pathlib import Path
import matplotlib.pyplot as plt
import pandas as pd
import xarray as xr
import sys

sys.path.append("../../src")

from fluxfootprints import (
    load_config,
    load_amf_df,
    build_climatology,
    summarize_periods,
    export_contours_gpkg,
    export_rasters_geotiff,
    export_contour_stats_csv,
)
1) Set Paths
Update these to point at your AmeriFlux config (.ini) and half‑hourly .csv.
[2]:
ini_path = Path("./input_data/US-UTE.ini")
csv_path = Path("./input_data/US-UTE_HH_202406241430_202409251400.csv")

assert ini_path.exists(), f"Config not found: {ini_path}"
assert csv_path.exists(), f"CSV not found: {csv_path}"

out_dir = Path("ffp_outputs")
out_dir.mkdir(parents=True, exist_ok=True)
2) Load Configuration & Data
load_config parses a minimal INI for site metadata and column mappings.load_amf_df reads the CSV, parses timestamps, sets the index to time, and replaces missing value sentinels【8†source】.[3]:
cfg = load_config(str(ini_path))
cfg
[3]:
{'station_latitude': 37.7353,
 'station_longitude': -111.5708,
 'missing_data_value': -9999.0,
 'skiprows': 0,
 'date_parser': '%Y%m%d%H%M',
 'ts_col': 'TIMESTAMP_START',
 'wind_dir_col': 'WD',
 'wind_spd_col': 'WS',
 'ustar_col': 'USTAR',
 'mo_length_col': 'MO_LENGTH',
 'v_sigma_col': 'V_SIGMA'}
[5]:
df = load_amf_df(str(csv_path), cfg)
display(df.head())
print("Time span:", df.index.min(), "→", df.index.max(), "| rows:", len(df))
| datetime_start | TIMESTAMP_END | CO2 | CO2_SIGMA | H2O | H2O_SIGMA | FC | FC_SSITC_TEST | LE | LE_SSITC_TEST | ... | TA_1_2_1 | RH_1_2_1 | T_DP_1_2_1 | TA_1_3_1 | RH_1_3_1 | T_DP_1_3_1 | TA_1_4_1 | PBLH_F | TS_2_1_1 | SWC_2_1_1 | |
|---|---|---|---|---|---|---|---|---|---|---|---|---|---|---|---|---|---|---|---|---|---|
| TIMESTAMP_START | |||||||||||||||||||||
| 2024-06-24 14:30:00 | 2024-06-24 14:30:00 | 202406241500 | 427.0199 | 0.628133 | 17.26862 | 1.019290 | 0.069210 | NaN | 156.40850 | NaN | ... | 29.95141 | 33.26877 | 12.052600 | 30.32464 | 33.45364 | 12.46181 | 30.06976 | 1665.4670 | 25.72815 | 22.44161 |
| 2024-06-24 15:00:00 | 2024-06-24 15:00:00 | 202406241530 | 425.9499 | 1.019297 | 15.18936 | 0.703052 | 0.285446 | NaN | 138.30920 | NaN | ... | 30.02516 | 29.22197 | 10.155240 | 30.35956 | 29.77183 | 10.72635 | 30.13765 | 1765.9350 | 25.52736 | 22.41975 |
| 2024-06-24 15:30:00 | 2024-06-24 15:30:00 | 202406241600 | 426.4163 | 1.965228 | 14.87533 | 0.808026 | 1.081928 | NaN | 154.11530 | NaN | ... | 30.24634 | 28.28498 | 9.838229 | 30.69433 | 28.63222 | 10.41335 | 30.40344 | 1495.7350 | 25.12511 | 22.32785 |
| 2024-06-24 16:00:00 | 2024-06-24 16:00:00 | 202406241630 | 426.0534 | 2.665907 | 15.61140 | 1.002919 | 0.519664 | NaN | 135.56180 | NaN | ... | 30.75179 | 28.75255 | 10.538220 | 31.14621 | 29.16225 | 11.09066 | 30.90061 | 1491.0620 | 24.63557 | 22.18172 |
| 2024-06-24 16:30:00 | 2024-06-24 16:30:00 | 202406241700 | 427.8476 | 1.102921 | 15.21034 | 0.703084 | 1.147608 | NaN | 95.06287 | NaN | ... | 29.16274 | 30.77158 | 10.165810 | 29.57434 | 30.96792 | 10.63069 | 29.30510 | 341.9711 | 24.14865 | 22.03216 |
5 rows × 61 columns
Time span: 2024-06-24 14:30:00 → 2024-09-25 13:30:00 | rows: 4463
3) Build the Footprint Climatology
build_climatology renames expected AMF columns (WD, WS, USTAR, MO_LENGTH, V_SIGMA) to the solver’s names and runs the xarray-based climatology (ffp_xr.ffp_climatology_new.run()), filling clim.f_2d with per‑timestep footprints【8†source】【9†source】.
[6]:
clim = build_climatology(
    df,
    crop_height=0.2,
    atm_bound_height=2000.0,
    inst_height=2.5,
    dx=10.0, dy=10.0,
    domain=(-500.0, 500.0, -500.0, 500.0),  # smaller domain for a quick start
)
clim
c:\Users\paulinkenbrandt\.conda\envs\py313\Lib\site-packages\xarray\core\computation.py:824: RuntimeWarning: overflow encountered in exp
  result_data = func(*input_data)
[6]:
<fluxfootprints.ffp_xr.ffp_climatology_new at 0x1dbfd64c980>
4) Summarize to Daily / Monthly
summarize_periodsnormalizes each time slice so that the sum over x,y = 1 (optional), then computes:Daily/Monthly means, and
ET‑weighted versions using ET derived from LE (mm/hr = LE / 680.6)【8†source】.
[7]:
summaries = summarize_periods(
    clim,
    df,
    et_source="LE",            # use LE (W/m^2) to derive ET weights
    daily=True,
    monthly=True,
    normalize_each_time=True,
)
summaries
[7]:
SummaryResult(f_daily_mean=<xarray.DataArray (time: 94, x: 101, y: 101)> Size: 8MB
array([[[3.58529140e-25, 2.47120712e-25, 1.30180180e-25, ...,
         1.15227703e-06, 1.12684997e-06, 1.10643026e-06],
        [1.61688067e-24, 1.13370153e-24, 6.17743647e-25, ...,
         1.17094169e-06, 1.13943374e-06, 1.11496572e-06],
        [8.02980544e-24, 5.72022119e-24, 3.21445865e-24, ...,
         1.19367042e-06, 1.15319902e-06, 1.12281202e-06],
        ...,
        [7.89861902e-07, 8.66178271e-07, 9.85317157e-07, ...,
         1.91956888e-09, 1.24349142e-09, 8.91069420e-10],
        [8.39947197e-07, 9.18133265e-07, 1.03986243e-06, ...,
         2.39246383e-09, 1.56477140e-09, 1.13021861e-09],
        [8.73933879e-07, 9.53281685e-07, 1.07660354e-06, ...,
         2.75318461e-09, 1.81129648e-09, 1.31460274e-09]],

       [[6.00464387e-08, 6.93686910e-08, 8.59536570e-08, ...,
         8.36127401e-07, 7.71296111e-07, 7.25343010e-07],
        [5.76548590e-08, 6.56121274e-08, 8.00248469e-08, ...,
         8.22083250e-07, 7.52786949e-07, 7.04452223e-07],
        [5.55611358e-08, 6.16154009e-08, 7.29662722e-08, ...,
         7.97210851e-07, 7.22668506e-07, 6.71809732e-07],
...
         3.14213432e-12, 5.17393930e-12, 6.98117705e-12],
        [2.48316745e-07, 2.78140787e-07, 3.25240203e-07, ...,
         1.27922703e-12, 2.14997600e-12, 2.93312486e-12],
        [2.63565473e-07, 2.94387970e-07, 3.42924024e-07, ...,
         5.96797930e-13, 1.02287541e-12, 1.41009881e-12]],

       [[3.16442287e-29, 2.07756927e-29, 9.92754305e-30, ...,
         1.34459763e-06, 1.22274851e-06, 1.14983677e-06],
        [2.02359675e-28, 1.35045737e-28, 6.67401798e-29, ...,
         1.32218080e-06, 1.21299288e-06, 1.14930747e-06],
        [1.38384239e-27, 9.37663921e-28, 4.77930180e-28, ...,
         1.30043662e-06, 1.21045092e-06, 1.16003900e-06],
        ...,
        [2.61500741e-11, 3.95106174e-11, 6.69961469e-11, ...,
         1.04762465e-32, 9.02016196e-34, 7.82860133e-35],
        [3.43706349e-11, 5.14967973e-11, 8.64417171e-11, ...,
         2.37573980e-32, 2.12353051e-33, 1.91994542e-34],
        [4.08616336e-11, 6.09039460e-11, 1.01599559e-10, ...,
         3.75726787e-32, 3.41639807e-33, 3.14638746e-34]]],
      shape=(94, 101, 101))
Coordinates:
  * x        (x) float64 808B -500.0 -490.0 -480.0 -470.0 ... 480.0 490.0 500.0
  * y        (y) float64 808B -500.0 -490.0 -480.0 -470.0 ... 480.0 490.0 500.0
  * time     (time) datetime64[ns] 752B 2024-06-24 2024-06-25 ... 2024-09-25, f_monthly_mean=<xarray.DataArray (time: 4, x: 101, y: 101)> Size: 326kB
array([[[8.10510828e-07, 8.32705618e-07, 8.66003392e-07, ...,
         6.10293228e-07, 5.89428859e-07, 5.75683345e-07],
        [8.20011752e-07, 8.42840319e-07, 8.77047518e-07, ...,
         6.20466844e-07, 5.99977115e-07, 5.86696874e-07],
        [8.33773596e-07, 8.57527474e-07, 8.93099934e-07, ...,
         6.36693265e-07, 6.17054153e-07, 6.04581333e-07],
        ...,
        [8.36745096e-07, 8.82601266e-07, 9.53745251e-07, ...,
         3.98781353e-09, 2.82500111e-09, 2.19225588e-09],
        [8.48915359e-07, 8.95735762e-07, 9.68021381e-07, ...,
         4.85582157e-09, 3.44132268e-09, 2.66227747e-09],
        [8.57641484e-07, 9.05001225e-07, 9.77869817e-07, ...,
         5.52079346e-09, 3.92153975e-09, 3.03476439e-09]],

       [[5.07956744e-07, 5.23480705e-07, 5.47241803e-07, ...,
         5.95632676e-07, 5.80325054e-07, 5.70417943e-07],
        [5.13159969e-07, 5.28725276e-07, 5.52536276e-07, ...,
         6.09337933e-07, 5.94032427e-07, 5.84105849e-07],
        [5.21123290e-07, 5.36751599e-07, 5.60646350e-07, ...,
         6.30248106e-07, 6.14821698e-07, 6.04754554e-07],
...
         8.76655203e-08, 8.52108402e-08, 8.34469755e-08],
        [9.89793700e-07, 1.01533439e-06, 1.05447861e-06, ...,
         8.47431952e-08, 8.26748120e-08, 8.11771385e-08],
        [9.74356013e-07, 9.99851206e-07, 1.03888352e-06, ...,
         8.26780863e-08, 8.08620673e-08, 7.95464388e-08]],

       [[7.95674211e-07, 8.17429635e-07, 8.48020398e-07, ...,
         7.48942523e-07, 7.06731501e-07, 6.79480477e-07],
        [8.00105939e-07, 8.23919460e-07, 8.57540738e-07, ...,
         7.49730417e-07, 7.08218660e-07, 6.81533409e-07],
        [8.04225877e-07, 8.31050416e-07, 8.69187806e-07, ...,
         7.51709785e-07, 7.11310410e-07, 6.85435066e-07],
        ...,
        [7.17721830e-07, 7.52958488e-07, 8.07412112e-07, ...,
         3.93268661e-08, 3.65701505e-08, 3.47342303e-08],
        [7.24507387e-07, 7.60311034e-07, 8.15314865e-07, ...,
         3.98906134e-08, 3.72056105e-08, 3.54119707e-08],
        [7.29481333e-07, 7.65533538e-07, 8.20710773e-07, ...,
         4.02336888e-08, 3.76019678e-08, 3.58406427e-08]]],
      shape=(4, 101, 101))
Coordinates:
  * x        (x) float64 808B -500.0 -490.0 -480.0 -470.0 ... 480.0 490.0 500.0
  * y        (y) float64 808B -500.0 -490.0 -480.0 -470.0 ... 480.0 490.0 500.0
  * time     (time) datetime64[ns] 32B 2024-06-01 2024-07-01 ... 2024-09-01, f_daily_et_weighted=<xarray.DataArray (time: 94, x: 101, y: 101)> Size: 8MB
array([[[ 3.04594887e-25,  2.09945851e-25,  1.10596916e-25, ...,
          1.46791745e-06,  1.43552331e-06,  1.40950863e-06],
        [ 1.37365009e-24,  9.63156549e-25,  5.24815239e-25, ...,
          1.49169187e-06,  1.45155039e-06,  1.42037789e-06],
        [ 6.82186581e-24,  4.85971692e-24,  2.73090123e-24, ...,
          1.52064054e-06,  1.46907889e-06,  1.43036503e-06],
        ...,
        [ 2.99540133e-08,  3.40140388e-08,  4.06101071e-08, ...,
          2.53970948e-09,  1.64521754e-09,  1.17894155e-09],
        [ 3.26505673e-08,  3.69868128e-08,  4.40083117e-08, ...,
          3.16537844e-09,  2.07029050e-09,  1.49535031e-09],
        [ 3.45535794e-08,  3.90779920e-08,  4.63885062e-08, ...,
          3.64263422e-09,  2.39645835e-09,  1.73930183e-09]],

       [[ 4.48064581e-08,  4.14789404e-08,  3.66749003e-08, ...,
          2.07247549e-06,  1.90863314e-06,  1.79230921e-06],
        [ 5.18785662e-08,  4.82704131e-08,  4.30632994e-08, ...,
          2.03473279e-06,  1.85926363e-06,  1.73667888e-06],
        [ 6.32913591e-08,  5.92471957e-08,  5.34108320e-08, ...,
          1.96805460e-06,  1.77878965e-06,  1.64944952e-06],
...
          9.40777249e-12,  1.54911403e-11,  2.09021380e-11],
        [-9.19200690e-09, -9.69012229e-09, -1.02817102e-08, ...,
          3.83009624e-12,  6.43718026e-12,  8.78198335e-12],
        [-9.52182045e-09, -9.96865891e-09, -1.04608744e-08, ...,
          1.78685523e-12,  3.06256136e-12,  4.22193561e-12]],

       [[ 6.68905595e-29,  4.39163085e-29,  2.09851508e-29, ...,
          2.96446272e-06,  2.69858543e-06,  2.53945096e-06],
        [ 4.27754204e-28,  2.85463900e-28,  1.41077478e-28, ...,
          2.91674515e-06,  2.67855559e-06,  2.53964592e-06],
        [ 2.92520929e-27,  1.98206330e-27,  1.01026375e-27, ...,
          2.87122226e-06,  2.67508189e-06,  2.56528548e-06],
        ...,
        [ 4.52261520e-11,  6.83185976e-11,  1.15828237e-10, ...,
          1.73373135e-32,  1.50682042e-33,  1.31741803e-34],
        [ 5.94259144e-11,  8.90302434e-11,  1.49437706e-10, ...,
          3.91184630e-32,  3.53473416e-33,  3.22310012e-34],
        [ 7.06425914e-11,  1.05288993e-10,  1.75638821e-10, ...,
          6.17085198e-32,  5.67671519e-33,  5.27574171e-34]]],
      shape=(94, 101, 101))
Coordinates:
  * x        (x) float64 808B -500.0 -490.0 -480.0 -470.0 ... 480.0 490.0 500.0
  * y        (y) float64 808B -500.0 -490.0 -480.0 -470.0 ... 480.0 490.0 500.0
  * time     (time) datetime64[ns] 752B 2024-06-24 2024-06-25 ... 2024-09-25, f_monthly_et_weighted=<xarray.DataArray (time: 4, x: 101, y: 101)> Size: 326kB
array([[[1.06678502e-06, 1.09543191e-06, 1.13890285e-06, ...,
         1.36145583e-06, 1.31384375e-06, 1.28277527e-06],
        [1.07954128e-06, 1.10903506e-06, 1.15352918e-06, ...,
         1.38490337e-06, 1.33869784e-06, 1.30911702e-06],
        [1.09752490e-06, 1.12843535e-06, 1.17473956e-06, ...,
         1.42284669e-06, 1.37950445e-06, 1.35246000e-06],
        ...,
        [4.91780005e-07, 5.04102371e-07, 5.23536436e-07, ...,
         5.03916543e-10, 3.70607384e-10, 2.99670687e-10],
        [4.79172922e-07, 4.92079703e-07, 5.12205039e-07, ...,
         5.90723007e-10, 4.27092725e-10, 3.38388323e-10],
        [4.71350181e-07, 4.84603293e-07, 5.05095668e-07, ...,
         6.59175505e-10, 4.73656472e-10, 3.72164520e-10]],

       [[1.45042039e-06, 1.49810925e-06, 1.56827210e-06, ...,
         9.13166954e-07, 8.84874074e-07, 8.66200239e-07],
        [1.45644152e-06, 1.50593754e-06, 1.57893653e-06, ...,
         9.30163477e-07, 9.01292895e-07, 8.82182013e-07],
        [1.46373500e-06, 1.51575543e-06, 1.59277328e-06, ...,
         9.55514109e-07, 9.25590171e-07, 9.05676691e-07],
...
         7.56016564e-08, 7.28841109e-08, 7.10660994e-08],
        [7.36933822e-07, 7.52405244e-07, 7.75549812e-07, ...,
         7.38626585e-08, 7.12424102e-08, 6.94861255e-08],
        [7.22732033e-07, 7.37960461e-07, 7.60547330e-07, ...,
         7.26962654e-08, 7.01465276e-08, 6.84391957e-08]],

       [[1.40309305e-06, 1.45293405e-06, 1.52489386e-06, ...,
         1.41182608e-06, 1.32986666e-06, 1.27725375e-06],
        [1.40138757e-06, 1.45420235e-06, 1.53068956e-06, ...,
         1.41224133e-06, 1.33217019e-06, 1.28101009e-06],
        [1.39534679e-06, 1.45236694e-06, 1.53538818e-06, ...,
         1.41491160e-06, 1.33773786e-06, 1.28861440e-06],
        ...,
        [5.23979932e-07, 5.45416401e-07, 5.77317462e-07, ...,
         3.30962489e-08, 2.95098753e-08, 2.71874150e-08],
        [5.25481920e-07, 5.46089808e-07, 5.76502095e-07, ...,
         3.47163663e-08, 3.10696461e-08, 2.86938616e-08],
        [5.26152613e-07, 5.46082717e-07, 5.75331480e-07, ...,
         3.58102628e-08, 3.21350883e-08, 2.97314605e-08]]],
      shape=(4, 101, 101))
Coordinates:
  * x        (x) float64 808B -500.0 -490.0 -480.0 -470.0 ... 480.0 490.0 500.0
  * y        (y) float64 808B -500.0 -490.0 -480.0 -470.0 ... 480.0 490.0 500.0
  * time     (time) datetime64[ns] 32B 2024-06-01 2024-07-01 ... 2024-09-01)
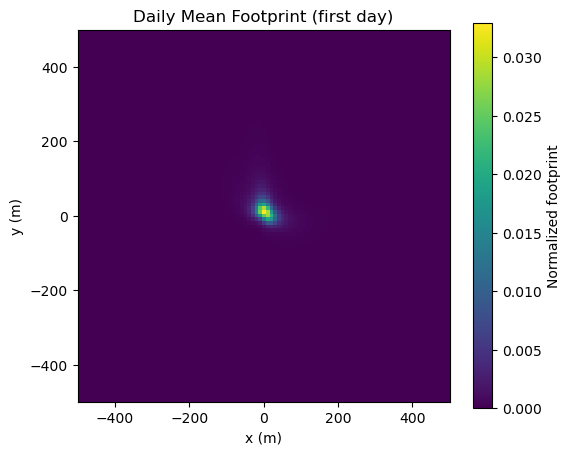
5) Quick Visualization
matplotlib; ensure you keep a single plot per figure and default colors.)[8]:
# pick the first day with data
da = summaries.f_daily_mean.isel(time=0)
plt.figure(figsize=(6, 5))
im = plt.imshow(da.values, origin="lower",
                extent=[float(clim.x.min()), float(clim.x.max()),
                        float(clim.y.min()), float(clim.y.max())])
plt.colorbar(im, label="Normalized footprint")
plt.title("Daily Mean Footprint (first day)")
plt.xlabel("x (m)"); plt.ylabel("y (m)")
plt.show()
6) Export 80% Contours to a GeoPackage
daily_mean_r80, monthly_etw_r80, etc.plt.contour that can use skimage or rasterio【8†source】.[9]:
gpkg_path = out_dir / "footprints_80pct.gpkg"
gpkg_written = export_contours_gpkg(
    clim,
    summaries,
    df=df,
    station_lat=cfg["station_latitude"],
    station_lon=cfg["station_longitude"],
    gpkg_path=str(gpkg_path),
    crs_out="auto",            # chooses a suitable UTM
    levels=(0.8,),             # export the 80% source-area contour
    contour_method="auto",
)
print("GeoPackage written to:", gpkg_written)
GeoPackage written to: ffp_outputs\footprints_80pct.gpkg
7) Export GeoTIFF Rasters
Each time slice (daily/monthly) is written as a separate .tif with correct georeferencing around the tower origin【8†source】.
[18]:
tif_dir = out_dir / "rasters"
export_rasters_geotiff(
    clim,
    summaries,
    station_lat=cfg["station_latitude"],
    station_lon=cfg["station_longitude"],
    out_dir=str(tif_dir),
    which=("daily_mean", "monthly_etw"),
    prefix="ffp",
)
tif_dir
[18]:
WindowsPath('ffp_outputs/rasters')
8) Export Contour Stats to CSV
Creates a compact CSV with area (ha) and centroid (lat/lon) for each contour and time slice【8†source】.
[10]:
csv_path = out_dir / "contour_stats.csv"
export_contour_stats_csv(
    df,
    clim,
    summaries,
    station_lat=cfg["station_latitude"],
    station_lon=cfg["station_longitude"],
    csv_path=str(csv_path),
    levels=(0.8,),
)
print("Stats CSV saved to:", csv_path)
pd.read_csv(csv_path).head()
Stats CSV saved to: ffp_outputs\contour_stats.csv
[10]:
| layer | time | r | area_ha | centroid_lon | centroid_lat | |
|---|---|---|---|---|---|---|
| 0 | daily_mean | 2024-06-24T00:00:00 | 0.8 | 1.455 | -111.570740 | 37.735527 |
| 1 | daily_mean | 2024-06-25T00:00:00 | 0.8 | 1.455 | -111.570789 | 37.735509 |
| 2 | daily_mean | 2024-06-26T00:00:00 | 0.8 | 1.425 | -111.570865 | 37.735552 |
| 3 | daily_mean | 2024-06-27T00:00:00 | 0.8 | 1.365 | -111.570802 | 37.735390 |
| 4 | daily_mean | 2024-06-28T00:00:00 | 0.8 | 1.345 | -111.570964 | 37.735380 |
Tips & Troubleshooting
If you see missing column errors, verify your CSV has the expected fields or update the INI to map the correct names. The helper expects AMF-like columns (e.g.,
WD,WS,USTAR,MO_LENGTH,V_SIGMA) and renames them internally【8†source】.ET weighting converts LE (W/m²) to mm/hr using
LE / 680.6【8†source】.For exports, ensure
geopandas,shapely,pyproj, andrasterioare installed.To change source-area levels, pass
levels=(0.5, 0.8)to the export functions.To use a fixed CRS (instead of UTM auto), pass
crs_out=EPSG_CODE.